Overview
Results view is a web application used to display various reports regarding performance data. Application should be implemented under ASP.NET MVC framework, and serve both as a GUI for end users, and as a RESTful web service (future improvement).
All heavy lifting regarding data analysis, processing and aggregation should be implemented in model part. Data is retrieved directly from database, processed and then delivered to controllers which send it to views.
Application should have at least two types of views: list view and aggregated view.
List view
This view displays “raw” call graphs. Initially it should display latest N logged entries (N is number of items per page, which is configurable).
Display
Diagram timeline scale is initially set to predefined value from .config file. Scale can be changed by a user, using a slider (jQuery component). Diagram should be refreshed considering new scale value on mouse-up event.
Individual calls are displayed as horizontal bars on diagram. Coloring is dependent on application and call name, i.e. one call should always have the same color. Bar length is determined by call duration, and should be proportional to diagram timescale. If call duration exceeds maximum possible diagram value then it should be represented in a specific way indicating that call duration is too long for current timescale (e.g. color it bright red etc). Bar should also have following info, displayed as text:
- application name
- call name
- time of call
- user identity
- call duration
Call graphs are displayed as calls (horizontal bars) grouped together. Position should corespond to time of log proportional to parent call. Top-level calls start at position zero.
Call graphs are initially collapsed (with shrunk subcalls), and can be fully expanded on mouse click. Hovering mouse over some call entry should display box containing all available details about that specific call. Collapsed call graph should have displayed minimized sub-calls on the bar bottom.
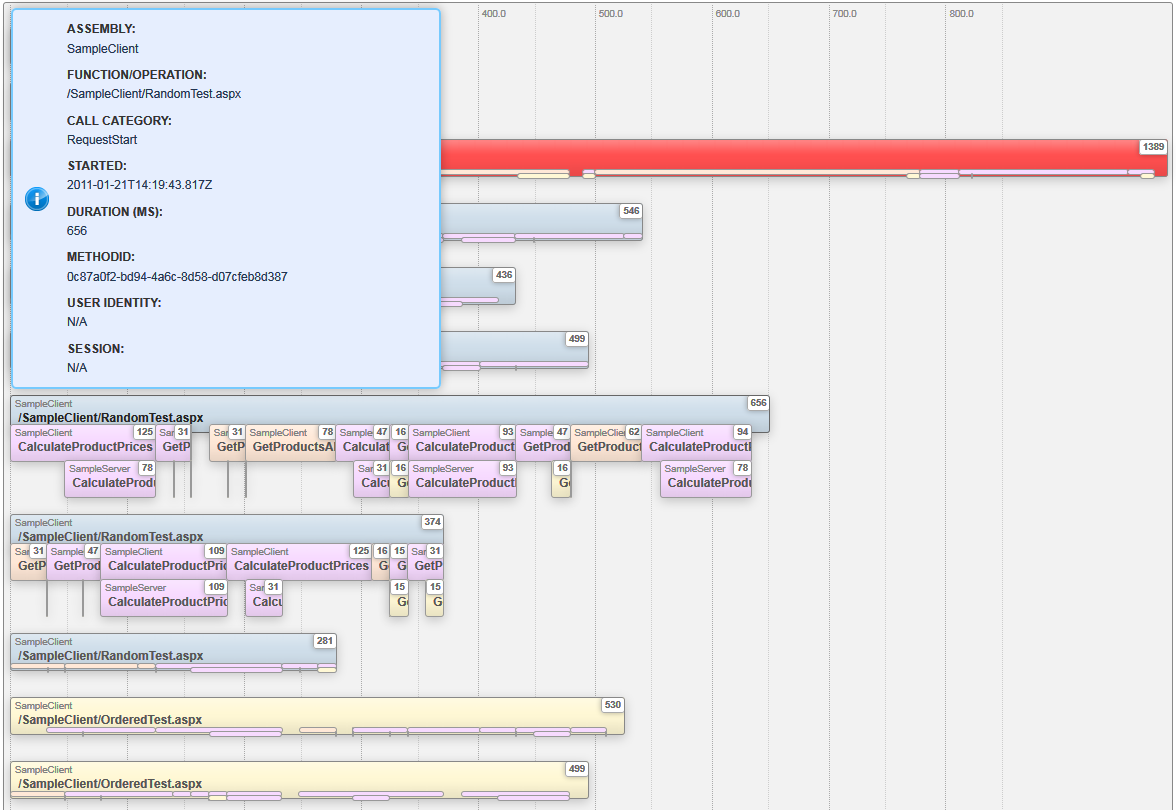
Image 1: List view screenshot.
Sorting
User should have the option to sort results by:
- time of call
- call duration
Sort order can be ascending or descending.
Filter
Results can be filtered by following criteria:
- time period – defined by from and to fields. If values are not selected by user then minimum ( from ) and maximum ( to ) values are used.
- call type
- Http Request
- External Api Call
- Api Invoked
- Database Call
- Inner Method Call
- application name
- call name
- duration – defined by min and max fields, measured in milliseconds. If values are not supplied by user then 0 and Integer.MaxValue are used
- exclude extremes – checkbox, when checked extreme durations are excluded from result set
Aggregated view
Aggregated view represents output of performance results aggregation and analysis. Results are grouped by application and call name, and for each group following data is displayed:
- total duration time
- hit count
- average execution time (total time / hit count)
Displaying
There are two ways how these results can be displayed: hierarchical and flat. User has the option to choose between these layouts. Hiearchical representation groups results by application and call name level by level, i.e. first grouping is done on 1st level, then results are grouped on immediate children of first level element and so on.
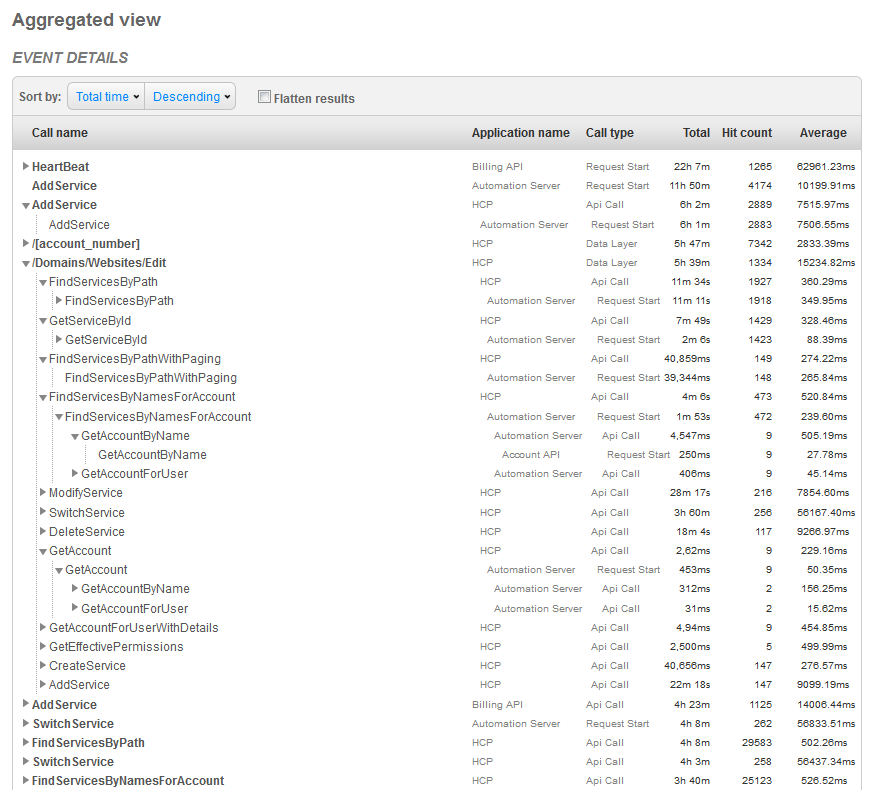
Image 2: Hierarchical results display example.
Flat representation does grouping by application and call name regardless of level where call exists.
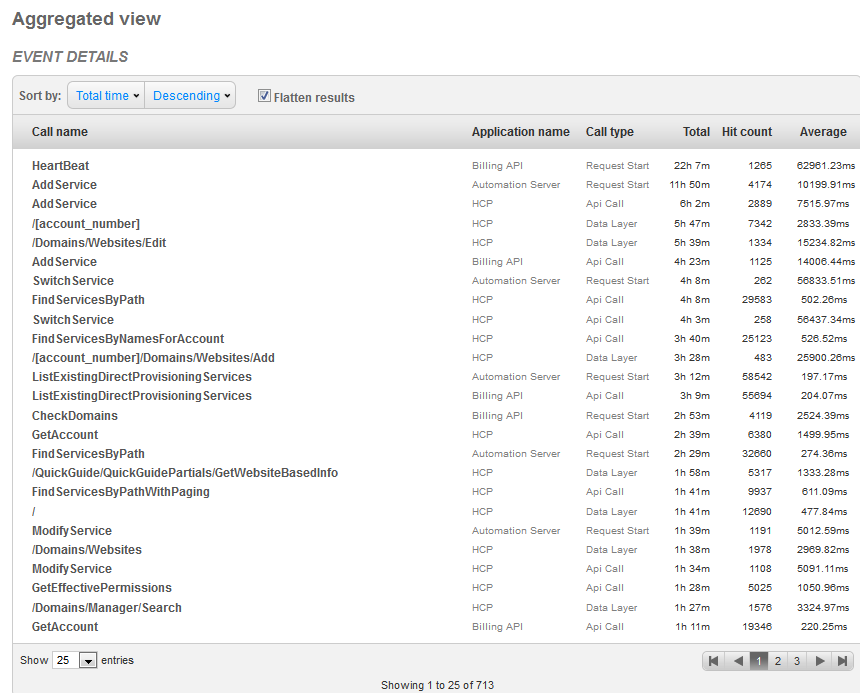
Image 3: Flat results display example.
Sorting
Results can be sorted by total duration time, and hit count.
Filtering
Filtering of results in aggregated view can be performed by:
- time period – defined by from and to fields. If values are not selected by user then minimum ( from ) and maximum ( to ) values are used
- call type
- Http Request
- External Api Call
- Api Invoked
- Database Call
- Inner Method Call
- application name
- call name
- aggregation source – represents results filtering relative to other results in subset
- all
- fastest 10%
- slowest 20%