How to create new or edit existing reports and how to view data provided by them.
Overview
The reports feature comes with a set of predefined billing reports which can be used out of the box without any additional configuration. This feature also allows you to create new custom reusable report data sources and reports which can be saved for future use by your staff.
Before you begin
The reports consist of two parts:
- Data source – Specifies how the data is fetched from the database (using SQL query or stored procedure), which columns that are available, and how data is formatted. It also specifies the filtering.
- Report definition – Specifies the columns which are shown in the report, their type, and segmentation options.
Data sources can be shared between reports. This means that one data source can provide data for a few different reports if they require similar data but differ in their presentation.
Creating a Data source
- Open Atomia Admin Panel and go to Reports > Billing Reports and click the Data Sources button to list available data sources.
- Click the Create new Data source button to open the form for adding a new data source.
- Give your Data source a name and (optionally) a description.
- Select the type of data source (SQL query or Stored procedure).
- Based on the previous choice, provide the query or the stored procedure name for retrieving the data.
- Click on the Check query button to test the entered query or stored procedure and fetch test data and available columns.
- If the entered query is not valid or the stored procedure fails to execute, check the error message, correct your query, and test it again by clicking Check query.
- Select the column you want to make available for reports by checking the check box in its row.
- Give the column a user-friendly alias which will be used as a column header in the reports.
- Select the data type for formatting of the column data.
- Repeat steps 7-9 for all desired columns.
- Order the columns in the required order using the Up and Down buttons.
- In the filters table, select the filters you want to enable with the data source.
- If you are using a SQL query data source type, map every filter to one of the selected columns.
- When you are done, press Save to store your Data source.
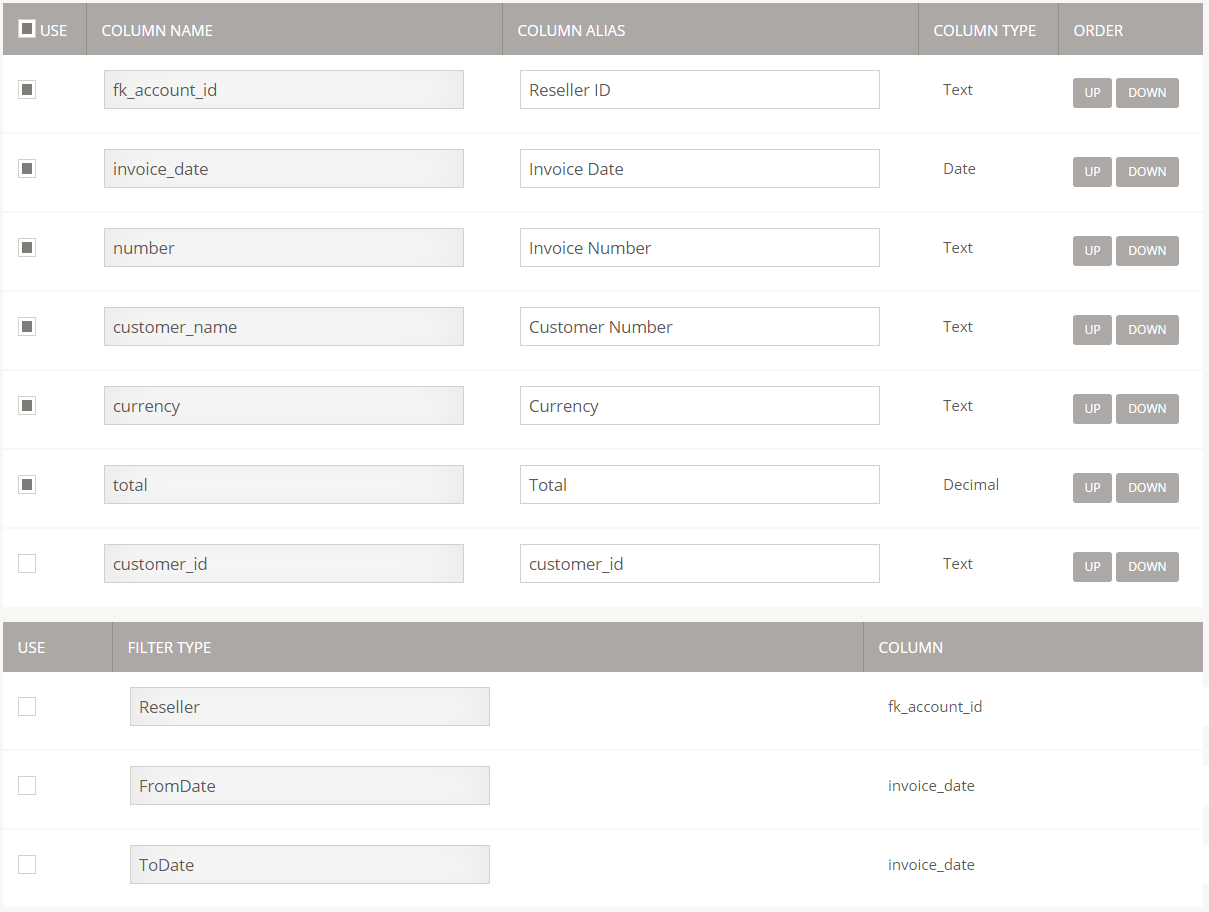
Image 1: Creating a Data Source.
Creating a Report
- Open Atomia Admin Panel and go to Reports > Billing Reports which lists existing reports.
- Click the Create new report button to open the form for adding a new report.
- Give your report a name and (optionally) a description.
- Select the data source for the reports which will list available columns.
- Select the column you want to show in the report by checking the check box in its row.
- Select the type of the column.
- Check the segmentation checkbox if you want to allow segmentation for the column.
- Repeat steps 5-7 for all desired columns.
- Order columns in the desired order using the Up and Down buttons.
- When you are done with all columns, press Save to store your report.
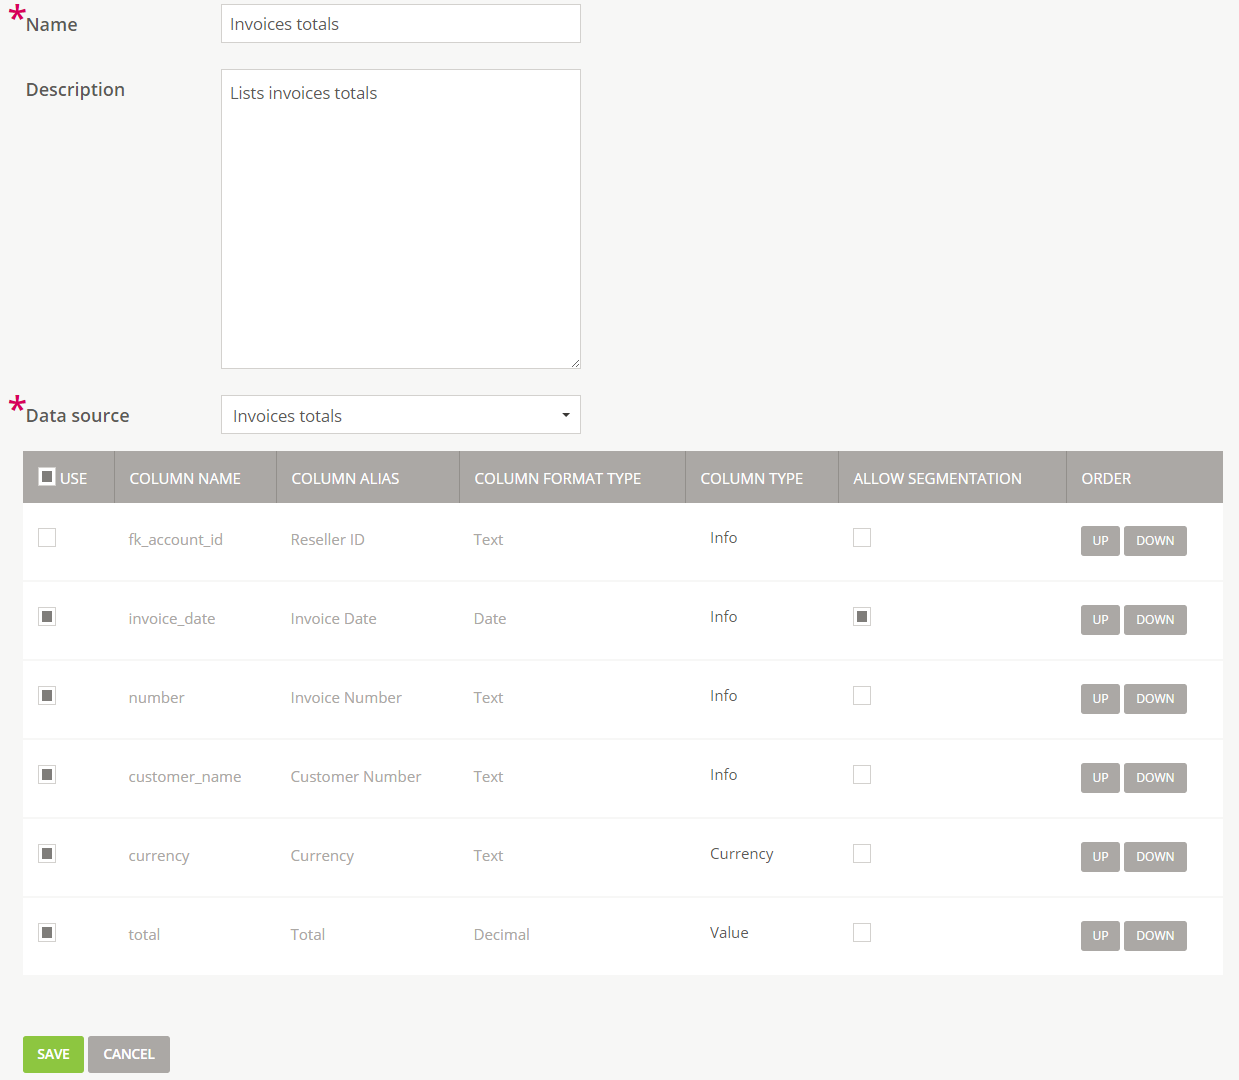
Image 2: Creating a Report.
Viewing reports
- Open Atomia Admin Panel and go to Reports > Billing Reports which lists existing reports.
- Click on the report name to load it with the default filters’ values.
- If the report has a reseller filter the current reseller from the reseller selector is used.
- If the report has a date period filter the current month will be used.
- Adjust the filters to the desired values.
- If the report has a reseller filter, change reseller using the reseller selector at the top of the page.
- If the report has period filter, click on date control to open the calendar and select the desired period.
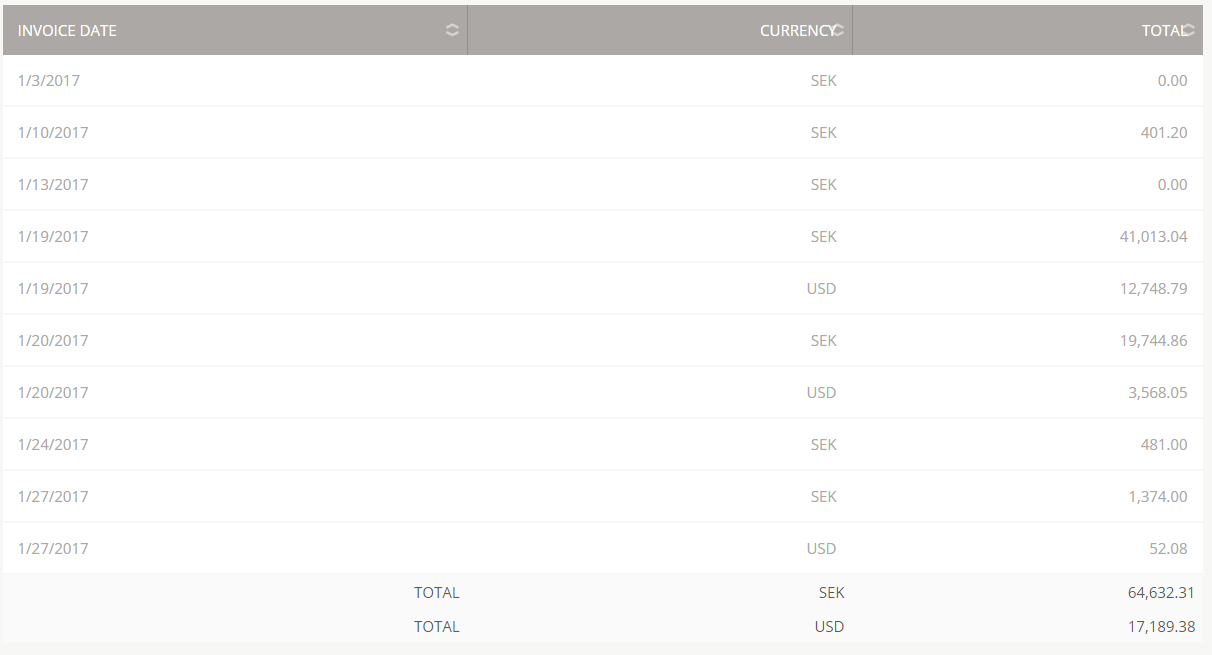
- The report will re-render with the selected values.
- Segment report data by selecting one or more segmentation columns from the drop-downs. When a segmentation column is selected the report engine performs segmentation by summing the value columns by selected segmentation and currency columns.
Downloading the report in CSV format
- Open Atomia Admin Panel and go to Reports > Billing Reports which lists existing reports.
- Click on the report name to load it with the default filters’ values.
- Adjust the filters to the desired values.
- Do segmentation if needed.
- Click the Generate CSV button to prepare data.
- Click the Download CSV button to download a CSV file to your computer.
Printing reports
- Open Atomia Admin Panel and go to Reports > Billing Reports which lists existing reports.
- Click on the report name to load it with the default filters’ values.
- Adjust the filters to the desired values.
- Do segmentation if needed.
- Select to show all data rows in the footer of the data table.
- Print the page directly from your browser. It will print the table only without other page elements.